"If there are a number of narrow and equidistant parallel openings in a screen each pair of openings will produce effects similar to those observed in Young's double slit experiment."
--A Text-book of Physics, A. Wilmer Duff (editor), P. Blakiston's Son & Co.
(1908), p. 410.
Preparation
Pre-lab assignment 6 (*.html)
(Due 12:00 AM before start of lab)
Equipment
rulers/metersticks (12", 1 m, 2 m)
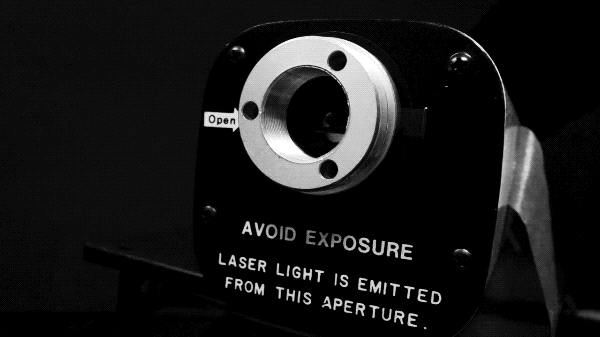
He-Ne laser (class 2)
adjustable lab jack
10×10 grid cm ruled graph paper (to be reused) (*.gif)
CD (foil label section peeled off)
masking tape
binder clips
laboratory laptop
Microsoft Excel
Big Ideas
Two slits spaced a distance d apart illuminated by light of a wavelength λ will produce constructive interference along certain θ directions when their path length difference Δℓ (approximated by d⋅sinθ) is an integer multiple of the wavelength:
d⋅sinθ = m⋅λ,
and this condition for maxima angle is also satisfied by "gratings" that have multiple openings spaced this same distance d apart.
Angles that cannot be measured practically using a protractor can be determined using trigonometry relations if the adjacent and opposite legs can be measured.
Data subject to experimental error can be estimated from the determining the standard deviation of a data set of independent measurements, and represented graphically using error bars.
Goals
Students work in groups to visually observe how a grating can produce constructive interference spots (maxima) on a screen, and to determine the spacing between adjacent slits in a grating.
Students statistically analyze measurements compiled from other groups working independently.
Students build upon previous best practices to independently write an individual lab report, which can be submitted early, on time, or late depending on their personal initiative.
Tasks
(Optimally form groups of two students, three only if necessary.)
1. Experiment Set-Up, Alignment, and Group Data
(Show calculations on worksheet to be checked-off; and to be included later in an individual, independent lab report.)- Lightly draw a vertical centerline in pencil across the short length of the graph paper, and tape this to a wall or other sturdy vertical surface (side of a box, etc.). This will be used to align your interference pattern of maxima spots, and as a ruler, and take care that it can be re-used by other groups after today's lab.
- Place a laser on an adjustable lab jack, and measure the diameter of the laser beam. Note safety precautions for avoiding eye exposure to the laser beam. Given that the space between adjacent tracks on a CD (compact disc) is 1.6μm, calculate how many tracks are expected to be illuminated by this laser beam when placed in front of the laser.
Number of illuminated CD tracks: __________.
- Tape the CD to the front of your laser, such that the beam passes through a clear section. The clear section of the CD that the laser beam passes through should be placed at either the "3:00" or "9:00" position; this is such that the tracks are vertically aligned (and act as vertical slits) to produce a horizontal pattern of maxima spots on the graph paper. Make slight adjustments to the CD such that the maxima spot pattern is aligned horizontally across the graph paper, and make sure that it is securely taped (but with not so much tape that the CD is "bowed").
- Move the jack stand to adjust the distance from the CD to the graph paper, and the direction of the laser such that the central maximum is exactly on the vertical centerline of the graph paper, and the −2 and +2 maxima each align with the left and right edges of the graph paper markings. Before taking measurements, re-check that the maxima spots are still aligned horizontally across the graph paper!
- Carefully measure the centers of each maxima spot, where the central maximum is set to be a 0.0 cm, and the two maxima to the left (−2 and −1) have negative distances, while the two maxima to the right (+1 and +2) have positive distances, and then finally measure the distance from the front surface of your CD to the graph paper.
Record your data in the spreadsheet below, which will find the angle θ for each maximum using θ = tan−1(y/L), and subsequently calculate the sine of that angle, sinθ. Do not enter the "A..." column headings and "1..." row headings, as those are just spreadsheet "coordinates." Sample cell formulas to be entered below are highlighted in yellow; cells to be copied and continued downwards are denoted with "⋮" symbols; and note that the CD-to-screen distance is automatically continued downwards using the "=B$3" function.
Measurement of sines of maxima angle on screens
| A | B | C | D |
| 1 |
"Maxima
number" |
CD-to-screen
distance |
Screen position
from centerline |
Sine of
maxima angle |
| 2 |
m
(unitless) |
L
(cm) |
y
(cm) |
sinθ
(unitless) |
| 3 |
−2 |
|
(−) |
=SIN(ATAN(C3/B3)) |
| 4 |
−1 |
=B$3 |
(−) |
⋮ |
| 5 |
0 |
=B$3 |
0.0 |
⋮ |
| 6 |
+1 |
=B$3 |
(+) |
⋮ |
| 7 |
+2 |
=B$3 |
(+) |
⋮ |
Write your results up on the classroom whiteboard. When four other groups have also collected their data, then enter their results (and yours) in the spreadsheet below.
2. Analyzing Multiple-Slit Interference as Double-Slit Interference
(Show calculations on your own worksheet, to be checked-off; and to be included later in an individual, independent lab report.)- Develop an experimental linear trendline equation of how the sines of the maxima angles sinθ (dependent variable) depends on the maxima number m (independent variable). Refer to the example data table below to create your spreadsheet; note that you are using your group's data from the previous table above, and data from four other groups. Do not enter the "A..." column headings and "1..." row headings, as those are just spreadsheet "coordinates." Sample cell formulas to be entered below are highlighted in yellow; cells to be copied and continued downwards are denoted with "⋮" symbols.
For the horizontal error bars, use the "Error Amount > Fixed Value" option to enter 0 (as the maxima numbers are to be considered exact values), and for the vertical error bars, use the "Error Amount > Custom > Specify Value" option to enter the standard deviation column for the positive and the negative error bar values.
Maxima number vs. experimental maxima angle sines
| A | B | C | D | E | F | G | H |
| 1 |
"Maxima
number" |
Your
data |
Group
2 |
Group
3 |
Group
4 |
Group
5 |
Sine value
average |
Sine value
std. dev. |
| 2 |
m
(unitless) |
sinθ
(unitless) |
... |
... |
... |
... |
sinθ
(unitless) |
σ
(unitless) |
| 3 |
−2 |
|
|
|
|
|
=AVERAGE(B3:F3) |
=STDEV(B3:F3) |
| 4 |
−1 |
|
|
|
|
|
⋮ |
⋮ |
| 5 |
0 |
0.0 |
|
|
|
|
⋮ |
⋮ |
| 6 |
+1 |
|
|
|
|
|
⋮ |
⋮ |
| 7 |
+2 |
|
|
|
|
|
⋮ |
⋮ |
(Refer to the previous labs for instructions on how to generate a graph with independent and dependent variables with a linear trendline and error bars.)
- Print out one copy of your data table, and print out one copy of your graph (with trendline equation and error bars) for review by your instructor, who will check off this off for your in-class work. Then print out more data tables and graphs (and an *.xlsx spreadsheet transferred via USB drive, e-mail, cloud, etc.) for each person in your group to use to independently write an individual lab report to be turned in at the start of the next lab.
- Since this graph has an independent parameter of x = m and a dependent parameter of y = sinθ, then the path length difference approximation from double-slit interference can be expressed in terms of a linear equation:
d⋅sinθ = m⋅λ,
d⋅y = x⋅λ,
y = (λ/d)⋅x + (0),
where the slope of this trendline would be expected to be λ/d (while the vertical intercept for the trendline would be expected to be zero). Determine the CD track spacing, given that the laser has a wavelength of 632.8 nm, with the appropriate number of significant figures (which is two?).
Experimental value for track spacing d = __________ m.
- On your individual worksheet, calculate the percent error between your experimental track spacing and the expected track spacing of 1.6 μm (it's okay if your data CD track spacing is probably slightly less than the expected 1.6 μm value for audio CD tracks, as manufacturers typically use a slightly smaller spacing on a "high-capacity data CD to "squeeze" more data (approximately 700+ MB) onto it than on an audio CD (approximately 650 MB).)
- On your individual worksheet, interpret your linear trendline R-squared value to conclude whether or not it is plausible that a "number of narrow and equidistant parallel openings in a screen" produces "effects similar to those observed in Young's double slit experiment"--that is, quantitatively how successful is using the d⋅sinθ approximation from double-slit interference for this interference of a large number (that you determined earlier) of multiple slits? (To be included in the conclusion of your independent lab report to be turned in during the next lab; this is for your instructor to check to see that you have taken all the necessary data in lab in order to write your report at home.)
- Documentation Rubric (task 2)
(Graded for the entire group)
| Score | Description |
| 3 | Sufficient amount of data points, graph/trendline and validation calculations complete, or very nearly so. |
2 | (No intermediate score possible.) |
| 1 | Substandard effort; insufficient data, problematic graph/trendline, validation calculations missing or incorrect. |
| 0 | Unacceptable or no significant effort. |
3. Independent, Individual Lab Report (checklist: (*.pdf))
(Due next lab)(You may either work on this during the rest of lab today, and/or later for homework.) Independently work on writing and complete an individual lab report, due next lab, which should include:- A descriptive abstract.
- Procedure (emphasis on materials used and how the experiment was set up (diagrams are okay), instead of step-by-step instructions).
- Data table, calculations and/or results.
- Write out concluding statements regarding the claim that a "number of narrow and equidistant parallel openings in a screen" produces "effects similar to those observed in Young's double slit experiment." Include the specific relevant numbers in these statements, such that each can be read (and cited) on its own without referring to the above calculations and numbers.
(Refer to previous labs for suggested best-practice guidelines for each of these sections.) - Lab Report Rubric
(Due next lab; each student works on their individual write-up individually)
| Score | Description |
| 3 | (Essentially) complete, thorough, understandable, with very few or no corrections. |
| 2 | Minor problems; some corrections/revisions needed. |
| 1 | Minimally acceptable effort, essential/critical revisions needed. |
| 0 | Unacceptable or no significant effort beyond original experimental work. |
- Submission Modifiers
(Added/subtracted from lab report points)
| Modifiers | Description |
| +1 | Report is turned in "early" on the same day of data-taking; or in the first 10 minutes of the next lab. |
| 0 | Report turned in any other time during the next lab. |
| −1 | Report turned in the day after the next lab; up to one week late. |
| −2 | Report turned in more than one week late. |
(No negative net points are possible for a lab report; the lowest possible grade (after applying the submission modifiers) is zero.)
Follow-up
Complete this week's lab report and post-lab assignment, next week's pre-lab assignment, and review lab instructions.
Due 12:00 AM before start of next lab
Post-lab assignment 6 (*.html)
|